Infection Control Deficiencies Showing Outsized Impact on Survey Star Rating
01 Feb
As we reported in December, CMS recently announced that the results of Focused Infection Control Surveys (FICs) conducted during the pandemic would be included in the Health Inspection (Survey) domain of the Five-Star program for Nursing Home ratings. This reversed course from a previous statement that these deficiencies would not contribute to Five Star, and we think this change — and the Focused Infection Control Surveys — are here to stay.
So with these FIC deficiencies now contributing to the Survey Star Rating, we were curious to see their impact. In general, even though 3131 facilities (about 20% of the total) experienced a change in their Star Rating, the national average Survey Star Rating only dipped 0.40%, despite new deficiencies, a pandemic, and a nine-month freeze.
Same Same, But Different
So as an article in McKnight’s points out, things didn’t change much. Why? One obvious factor is the lack of Standard Survey volume. Going off the assumption that homes are typically surveyed once a year, we expect 1/12 of homes to be surveyed each month. In normal times, a nine-month freeze would mean that 9/12 or 75% of homes would have received a Standard Survey. But the latest data from CMS shows that only 9% of homes have had a new Standard Survey since the freeze set in on March 3, 2020. It’s not a total surprise given the restrictions of the pandemic, but CMS issued guidance as early as May on how states could resume Standard Survey activity.
One key factor is that the state-based Survey cutpoints did what they were supposed to do, and adjusted to the new reality on the ground. Cutpoints were “loosened” in 39 states, meaning that a slightly higher Overall Weighted Survey Score doesn’t necessarily mean a lower Star Rating.
But if 39 states “loosened,” it must mean that all things equal, Overall Weighted Survey Scores in each state actually rose since they were last set. That would mean that despite the slowdown, facilities were, on average, doing worse. And they did. The Average Overall Weighted Survey Score rose 4% from 60.13 to 62.57 nationwide. But if Standard Surveys didn’t move much, what did? Let’s start with Complaint Surveys.
Complaint Surveys
Funny enough, the freeze served to lessen the impact of Complaint Surveys. To start with, the number of Complaint Surveys was down nearly 50% from 2019 to 2020.
Typically, Complaint deficiencies account for over 25% of all deficiencies and over a third of all the deficiency points. So any slowdown in Complaint activity could lead to a decline in Survey Points, and therefore, a theoretical increase in Survey Star Rating.
Another factor that should have boosted the Survey Star Ratings is Complaint deficiency aging. Standard Surveys form the basis of each of the 3 cycles on which the Survey Star Rating is based, and while deficiencies from those Surveys remain pinned to their respective cycle, Complaint deficiencies move between the cycles based on a rolling 12-month period that advances each month. (Click here to read more about how the Survey Star Rating is calculated). As they move, say from cycle 1 to cycle 2 for example, their impact on the Overall Weighted Survey Score lessens. A 12-point deficiency in cycle 1 contributes 6 points; in cycle 2, it only contributes 4 points. Since the 12-month Complaint deficiency timeframe just reset for the first time since March 2020, thousands of Complaint deficiencies just moved from cycle 1 to cycle 2, cycle 2 to cycle 3, and from cycle 3 to not even impacting the score anymore. And with fewer new Complaint deficiencies to take the place of old ones, we expect lower Overall Weighted Survey Scores and higher Star Rating.
The Impact of Infection Control
So with Standard Surveys mostly stagnant and Complaint deficiencies declining, why are scores still going up? Time to look into the new kid on the block — Infection Control. As we know, these FIC deficiencies only affect cycle 1 so far. So keeping in mind that CMS may mark a deficiency as more than one type, let’s look at how they stack up to Standard and Complaint deficiencies:
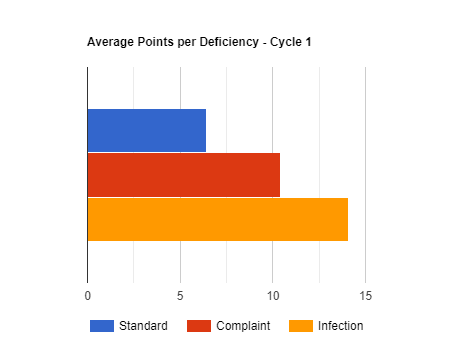
Looking first at deficiency count, we can see the expected drop in Complaint deficiencies alongside the new FIC deficiencies. In terms of deficiency points, the impact is even more clear. While FIC deficiencies only account for 9.68% of the total number of deficiencies cited, they cover nearly 18% of the points assessed. If we look at points per deficiency, the impact is even more pronounced.
FIC citations average 14.1 points per deficiency, while Standard deficiencies only reach 6.4. All this bodes poorly for homes moving forward. We don’t think FIC surveys — or their inclusion in Five Star — are going away anytime soon, and if the impact on cycle 1 is dramatic enough to offset the dropoff in Complaint surveys, it seems from the data so far that facilities can expect that higher scores to be the new normal. State-based cutpoints will continue to help offset some of the impact, and we expect that FIC surveys will become less frequent as the pandemic eases. But facilities will still have to contend with a new reality, and we expect that enforcement will continue to be uneven and unpredictable, with homes more susceptible than ever to the whims of the surveyor.
Want more insights like this? Follow our blog for more, or use the form below to sign up for our monthly newsletter.
Related Posts
Stay In Touch
Sign up for our newsletter to get the latest updates, insights and analysis from the StarPRO team