Unfrozen Staffing Star Ratings Rise, Defying Expectations
09 Nov
Frozen No More
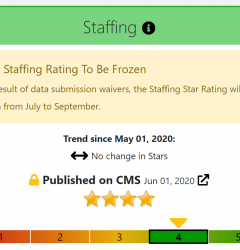
At the onset of the Covid-19 pandemic, CMS issued several waivers to help facilities focus on patient care rather than on reporting requirements. In addition to the earlier halt of standard Survey activity, these waivers covered both MDS and PBJ data, resulting in freezes to several of the Star Rating domains. But the waiver for Staffing/payroll data was lifted for 2020 Q2 data, meaning that facilities were required to report PBJ data on August 14. As a result, CMS was able to publish that data along with the related Star Rating changes in their most recent update at the end of October.
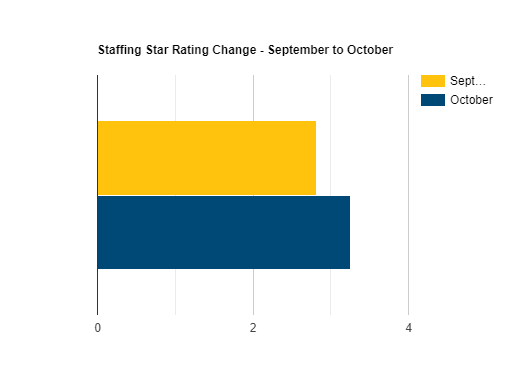
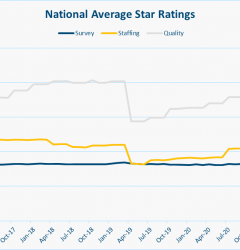
Based on both major news stories and anecdotal feedback from facilities close to us, we were expecting those Star Ratings to go down. But to our surprise, the National Average for Staffing Star Ratings actually rose 11% from 2.82 to 3.26.
Our figures are based on a comparison between the recently released October 2020 data with September 2020 data. Note that with a few exceptions, the September data reflects the frozen 2019 Q1 data reported in April 2020. Confused about what quarter’s data is reported when? Here’s a short guide:
| Calendar Quarter of PBJ data | Star Ratings Published | Note |
| 2019 Q4 | April 2020 | |
| 2020 Q1 | Not Published | Star Ratings “Frozen” |
| 2020 Q2 | October 2020 |
All figures below represent the average of all 15,000+ homes across the nation, unless otherwise indicated. In total, more than a third of the facilities saw their rating change, and of those, only a third saw their rating decline. The majority saw their Staffing Star Ratings improve.
But why? With everyone pointing to staffing shortages, why did the Star Ratings actually go up? Let’s examine a few contributing factors.
The Staffing Matrix and an Increase in “Adjusted” Hours
As outlined in our Explainer on Staffing Star Ratings, the Staffing Star Rating is based on two components — RN Staffing and Total Nurse Staffing. In this article we focus mainly on Total Nurse Staffing, but we found that similar trends were borne out in RN Staffing as well. CMS calculates a figure called the Adjusted Hours per Resident Day (HRD) for each staffing component, then uses the matrix below to determine their Staffing Star Rating.
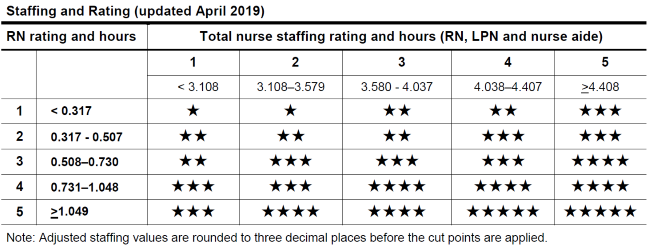
While we expected that CMS might make some changes to the matrix as a result of the shifts in the underlying staffing data, it wasn’t modified at all. And with the below increases in Adjusted HRD, it makes sense that we saw so many facilities receiving higher Staffing Star Ratings.
- Total Staffing Adjusted HRD rose 3.7% from 3.746 to 3.885
- RN Adjusted HRD rose from 9.6% from 0.680 to 0.745
But what accounts for the increases in Adjusted HRD?
Reported Staffing Hours
The Adjusted Hours per Resident Day mentioned above is calculated based on three elements, shown below:
(Reported HRD / Case-Mix HRD) * National Average HRD = Adjusted HRD
So the first place we looked was the Reported hours. Covid-19 affects staff as well as patients, so we expected an increase in call-outs and sick days. And with CNA wages so low in general, we’ve been hearing that turnover has increased as staff exit the sector in search of work opportunities with fewer hazards. But the numbers don’t bear this out:
- Total Reported HRD rose 4.9% from 3.86 to 4.05
- RN Reported HRD rose from 8.7% from 0.69 to 0.75
Raw Staffing Hours vs Occupancy
There are two components to Hours per Resident Day, the hours part, and the “per resident day” part. Let’s look at both. RN Hours worked decreased 2.88% and Total Nurse Hours declined 6.80%, so it is true that in a real sense, staffing declined. But then how do we explain Reported HRD going up?
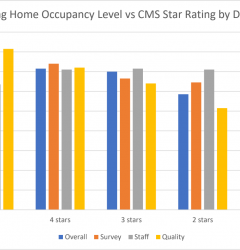
During the same period, Occupancy declined nearly 10% from 80.67% to 73.34%. Since more hours were worked to care for fewer patients, an increase in Hours per Resident Day actually makes sense.
Case-Mix / Estimated Hours
The Case Mix or Estimated Hours per Resident Day is calculated based on the acuity or clinical complexity of patients in the facilities. While we thought that an increase in Covid-19 patients and a decrease in lower acuity short-term patients recovering from elective surgery would lead to an increase in Case-Mix HRD, and it seems to have done that for RN, but not for Total Nursing:
- Total Staffing Case Mix HRD fell 0.5% from 3.207 to 3.188
- RN Case Mix HRD rose from 2.7% from 0.376 to 0.386
Because we’re averaging all homes across the nation, these figures cover both the Case Mix and National Average elements of the equation. As a result, while each home will have different calculations, these changes mostly cancel each other out at the national level.
Reprieve from Staffing “Downgrade”
Normally, facilities that fail to submit PBJ data, or that submit data with a 4+ day stretch with no RN staffing get downgraded to 1 Star in Staffing. But according to the October updated to the Five Star Technical User’s Guide, CMS has issued a reprieve to these facilities by instead marking them as “Rating Not Available.” While this non-rating doesn’t help facilities with their Overall Star Rating, it also prevents close to 1000 facilities from potentially receiving a one-star “penalty” on their Overall Rating (See our Star Rating Overview for more detail). Since normally there are 1000 or so facilities with a rating of 1, which brings down the average. We exclude “Rating Not Available” facilities from our average calculations, so this may also explain some of the increase in Average Staffing Star Rating.
Summary
Our analysis concludes that the surprising increase in Staffing Star Ratings despite widespread concerns about low staffing levels can be attributed to a few factors:
- The lack of a “downgrade” for homes that failed to submit PBJ data
- A decrease in Occupancy that outpaced a smaller decrease in actual nursing hours worked, resulting in higher Reported HRDs
- Subtler changes to Case Mix/Acuity
So what does this mean going forward? Despite the surprise of higher ratings, these figures seem to prove the resiliency of CMS’s staffing model, and its ability to flex along with changing conditions. Next quarter, CMS will resume “downgrading” facilities that fail to submit PBJ data, so that becomes as imperative as ever. We’ll continue to monitor the impact of changes in both raw staffing hours, occupancy, and acuity as it relates to the Star Ratings. For more updates like this, be sure to sign up for our newsletter below.
Related Posts
Stay In Touch
Sign up for our newsletter to get the latest updates, insights and analysis from the StarPRO team