
Understanding Nursing Home Quality Measures
Medicare Quality Stars Overview
Patient health is at the top of the priority list for any Nursing Home.
The Nursing Home Quality Star Rating is based on 15 measures of resident health covering conditions like bed sores, key medications, and adverse occurrences like falls and ER visits.
A facility earns points for their performance in each Quality Measure or QM, and their total number of points determines their Overall Quality Star Rating, as well as two sub-ratings, Short Stay Quality Rating and Long Stay Quality Rating.
Meet The Measures
Nursing Home Quality Star Rating Measures are divided into two major sections –
Short Stay and Long Stay.
Short Stay residents are typically in the facility briefly for rehab while Long Stay residents are expected to remain in the facility.
In addition, QMs can be either MDS-based, or claims-based.
MDS-based measures are calculated from Minimum Data Set (MDS) Assessments, or surveys of resident health, that get submitted to CMS each quarter.
Claims-based QMs are calculated based on Medicare claim data submitted by the facility on a well after care has been delivered, so these measures often have a lag time of a year or more.
Finally, some measures are Risk Adjusted.
This means that some residents may be more or less predisposed to the condition that the QM measures. For example, a QM measuring mobility improvement will be adjusted for the resident’s age.
All measures are calculated as percentages, with “triggering” residents serving as the numerator, and a set of qualifying residents serving as the denominator. If the measure is Risk Adjusted, the basic (observed) percentage will be adjusted.
Here we see the facility percentage for a sample facility as the Published value alongside the state and national average, with a history of the facility’s performance.
For extra details on the measures, see the detailed specifications on CMS’s website.

Calculating Points
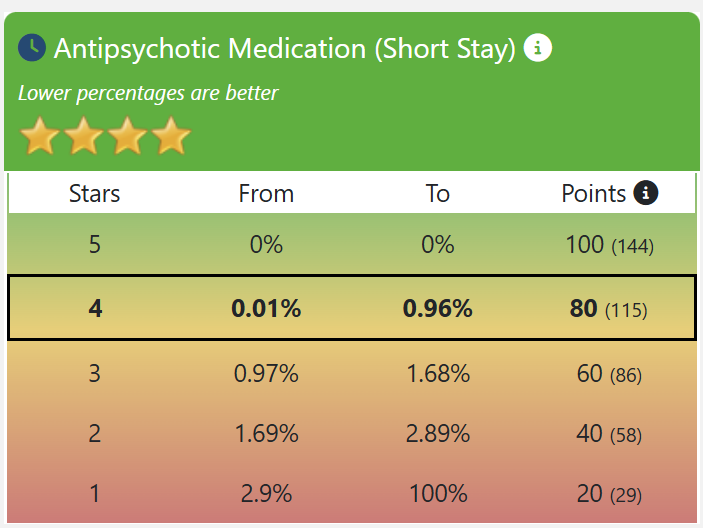
Once the percentage is calculated, it can be compared against a matrix of cutpoints to determine how many points a facility earns for each QM.
The maximum number of points is either 100 or 150, depending on the measure.
In this example, the facility’s percentage of 0.7% means that the facility earns 80 of a possible 100 points towards their total.
Although this facility is doing well on this measure, they can do better. Reducing this measure to 0% will move the facility up a slot and earn it an additional 20 points.
But wait, notice the point values in parentheses? Since there are fewer Short Stay measures than Long Stay, the Short Stay measures are given an increased weighting when counting the final points.
As a result, smart facilities focus in on their Short Stay measures, as they contribute 44% more points towards the Overall Star Rating.
Calculating The Quality Star Ratings
Once the number of points has been calculated for each QM, they’re totaled, both within their individual Long Stay/Short Stay buckets, and in total, to determine the Overall Quality Rating.
Here’s that calculation for our sample facility:
Short Stay
| ED Visit | 135/150 |
| Successful Community Discharge | 135/150 |
| Pressure Ulcers | 100/100 |
| Antipsychotic Medication | 100/100 |
| Discharge Function Score | 150/150 |
| Hospital Readmissions | 150/150 |
| Total | 770/800 |
| After Adjustment (Multiplied by 1150/800) |
1107/1150 |
Long Stay
| Catheter | 60/100 |
| Falls w/Injury | 80/100 |
| Antipsychotic Medication | 120/150 |
| Decline in Activities for Daily Living | 135/150 |
| Hospitalizations | 150/150 |
| ED Visits | 150/150 |
| Pressure Ulcers | 150/150 |
| UTIs | 100/100 |
| Mobility Decline | 150/150 |
| Total | 1045/1150 |
Similar to Survey and Staffing, Quality also has a set of cutpoints in a matrix to determine Star Ratings.
Using them, we can see that our sample facility is well in the 5-star range for both Short Stay and Long Stay Ratings, and with a combined total of 2152, they're comfortably within the top tier of the Overall Quality Rating as well.
