11 Jul
Change is Inevitable
On Thursday July 8, CMS finally announced the details of the long-awaited changes to the Staffing Star Rating calculations. CMS had previously signaled their intention to incorporate weekend staffing and turnover measures into the Star Rating, but hadn’t indicated how they might do that until now. Here at StarPRO, we’re hard at work understanding and integrating these new changes. Below is a summary — read on below for more.
The Upshot
- The Staffing Star Rating has expanded from two measures to six, adding measures of weekend staffing and turnover, and calculating the rating based on points earned in each measure.
- If the new system were in place now, almost 40% of homes would lose at least one Staffing Star.
- Homes will no longer receive a “bonus” Overall Star for having a 4 in Staffing. If just that change was implemented today, over 10% of homes nationwide would lose an Overall Star.
- In bringing the distribution of the Staffing Star Ratings more in line with Survey, operators should be concerned that the Quality Star Rating may follow suit.
Goodbye Matrix, Hello Points
Under the new points-based system, the two existing measures – RN and Total Case-Mix Adjusted Staffing Hours per Resident Day – still make up more than half of the Staffing Star Rating. But new measures of Weekend Staffing and Turnover have now entered the mix. Here’s how the six measures break down:
- Adjusted Case-Mix RN HRD – 100 points in deciles
- Adjusted Case-Mix Total HRD – 100 points in deciles
- Adjusted Case-Mix Total Weekend HRD – 50 points in deciles
- RN Turnover – 50 points in deciles
- Total Staffing Turnover – 50 points in deciles
- Administrator Turnover (number of admins that left during the year) – 30 points for none, 25 for 1 and 10 for 2 or more
The total available points from these six measures is 380, and the Staffing Star Rating will be based on the following cutpoints:
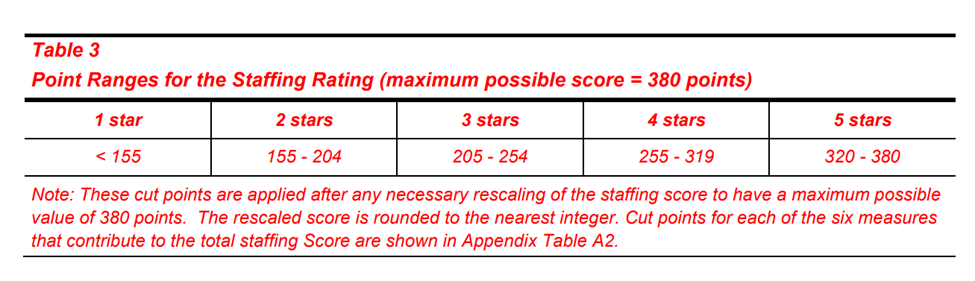
The first three measures are based on the most recent quarter of PBJ data and are required for the home to have a Star Rating. Homes with missing or incorrect data are either not rated or penalized to 1 star. Turnover measures are calculated based on six full error-free quarters of PBJ data, and as a result, around 20% of homes nationwide are missing one or more of these measures. However, these homes are still rated by adjusting the points.
To do this, CMS uses a method similar to the Short Stay QM calculation method, which is to make an adjustment based on the points achieved vs the total possible points. So if a home is missing Administrator Turnover for example, they can only achieve 350 total possible points. If they achieve 300 points in the other 5 measures, that score is multiplied by (380/350) to scale up the point total to an adjusted total of 326, which is then used to rate the home.
What Does This Mean for Homes?
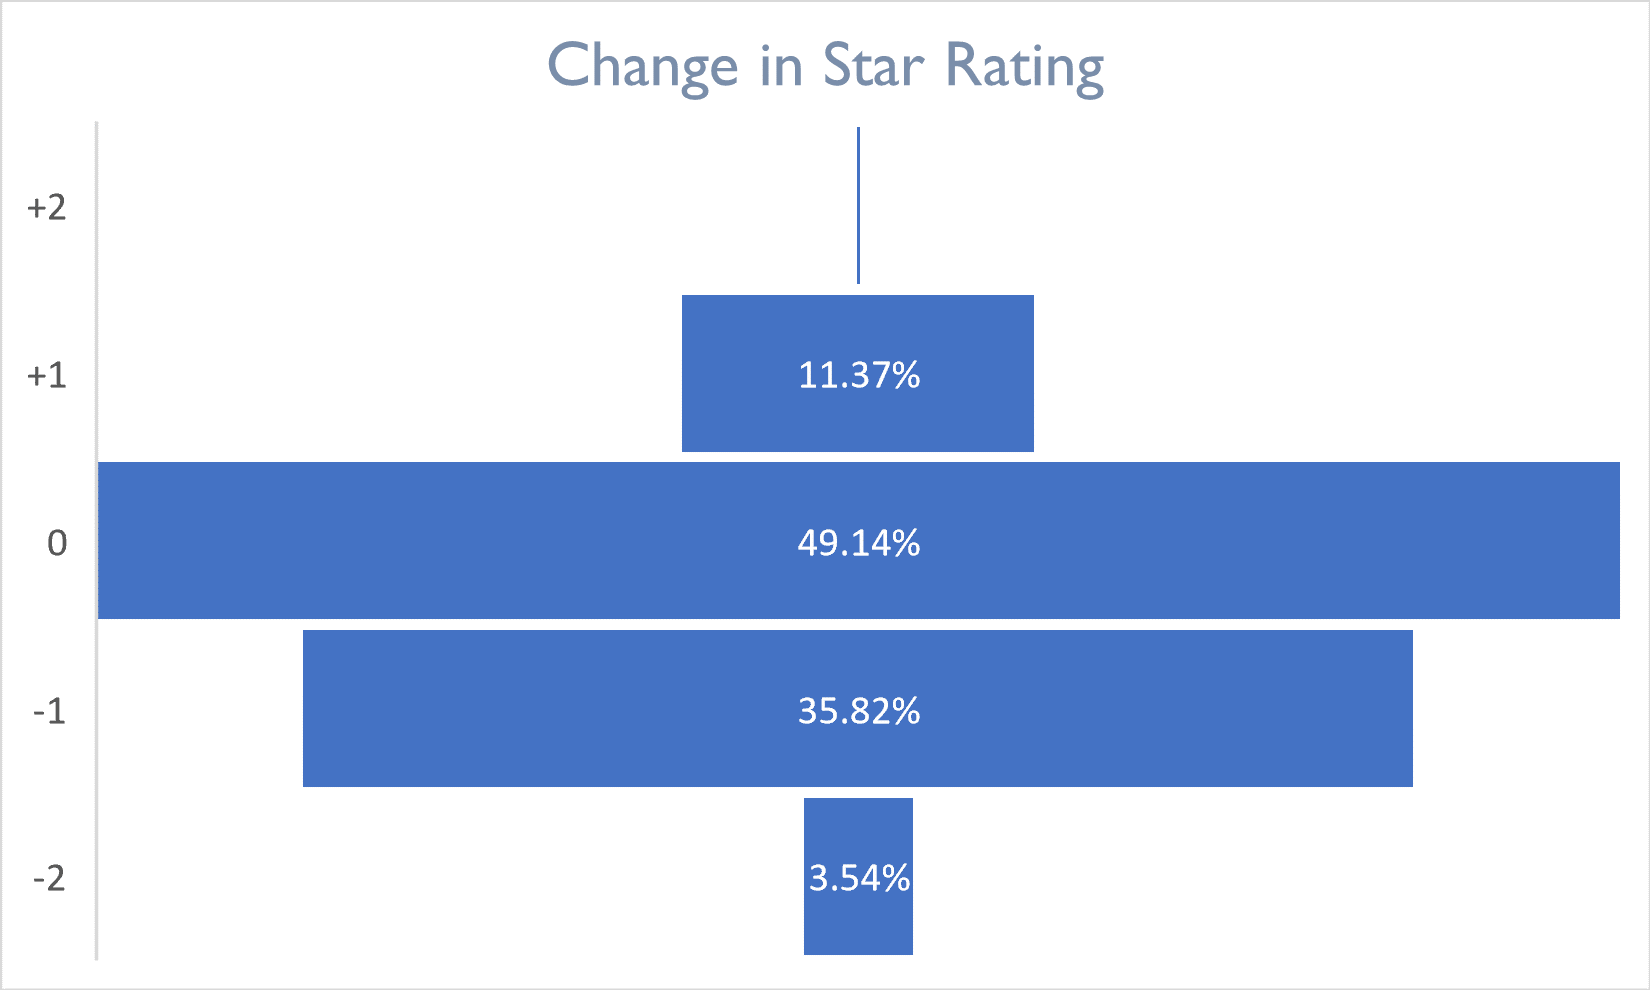
To understand the impact of these changes if they were implemented today, we loaded up our database with the new metrics and “re-rated” every home in the country based on June data. After excluding any home that was not rated or penalized for missing data, the most stark difference was the precipitous drop in Staffing Star Ratings across the board. While more than 50% of homes would retain their same Star Rating under the new system, nearly 40% would lose at least one star.

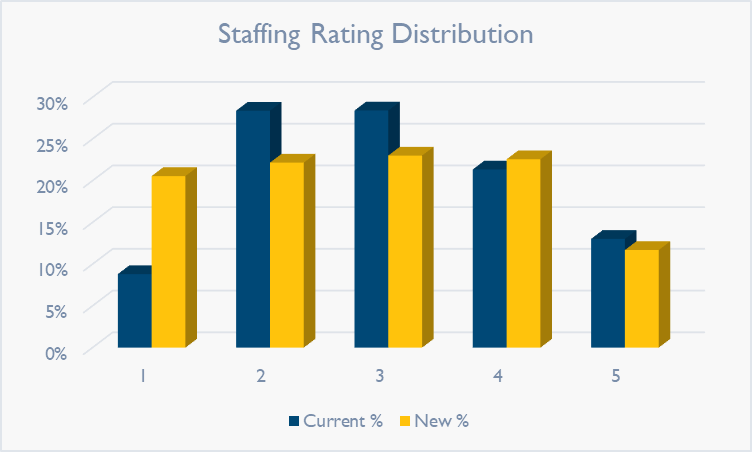
A (Not So) New Distribution
To understand this, we looked at the distribution of the Staffing Star Ratings and noticed that while the percentage of 4- and 5-star homes stayed relatively level, the percentage of 1-star homes jumped up from under 10% to over 20% of the total, which comes at the expense of 2- and 3-star homes:
A closer reading of the CMS Technical User’s Guide gives us some context for this new distribution. CMS uses the following logic for their distribution of Health Inspection (Survey) Star Ratings:
- The top 10 percent (with the lowest health inspection weighted scores) in each state receive a health inspection rating of five stars.
- The middle 70 percent of facilities receive a rating of two, three, or four stars, with an equal number (approximately 23.33 percent) in each rating category.
- The bottom 20 percent receive a one-star rating.
A quick view of the numbers seems to confirm that this is what CMS is aiming for in Staffing as well:
| Staffing Rating | New % | “Target” % | Delta |
| 1 | 20.56% | 20.00% | -0.56% |
| 2 | 22.16% | 23.33% | 1.17% |
| 3 | 23.02% | 23.33% | 0.31% |
| 4 | 22.57% | 23.33% | 0.76% |
| 5 | 11.70% | 10.00% | -1.70% |
We’re still not sure how often CMS will update the cutpoints for each of the six measures, but our guess is that whenever the distribution drifts too far away from this target, they’ll make some changes.
Implications for the Quality Star Rating?
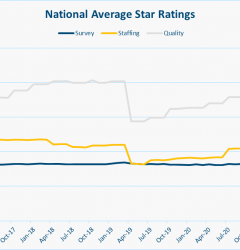
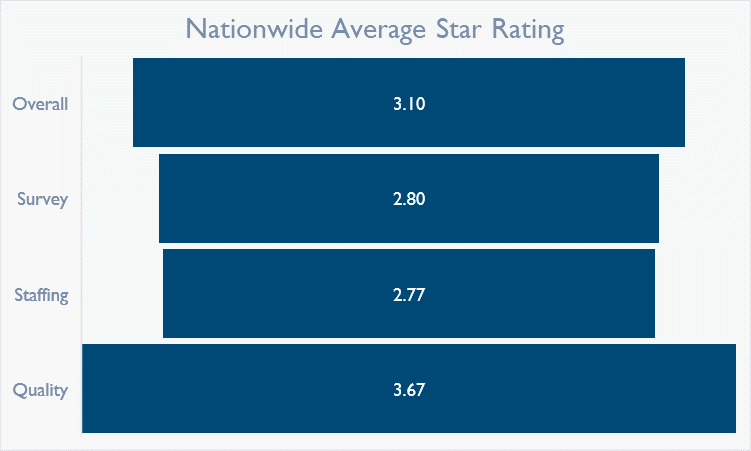
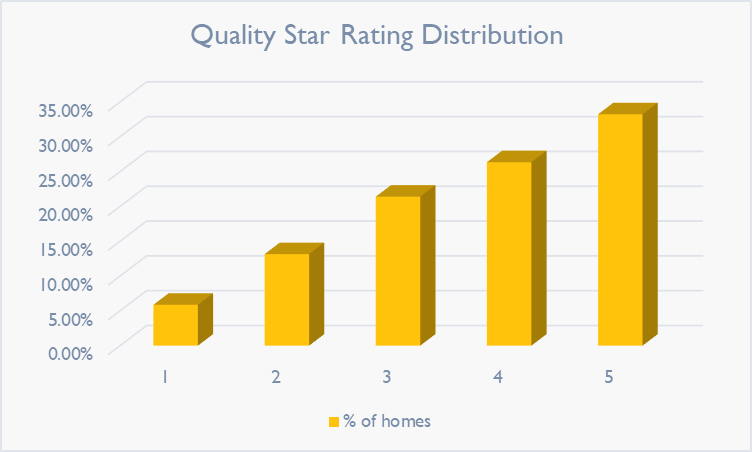
What concerns us here beyond the immediate and obvious blow to homes already suffering with severe staffing shortages and skyrocketing agency costs is the potential impact to the Quality Star Rating. With both Staffing and Survey now both adhering to this 20/70/10 distribution, Quality could be next. Since Quality has by far the most bloated nationwide average (3.67 compared to Staffing at 2.77), and over 30% of homes have earned 5 stars. So our crystal ball tells us that CMS may be looking to “normalize” this top-heavy distribution soon.
Goodbye “Bonus” Star
The other bomb CMS dropped was that homes with a 4 star rating in Staffing will no longer be eligible for the “Bonus Star” to increase their Overall Star Rating. This is likely to be a bitter disappointment for over 1500 homes that currently benefitting from this perk. Operators that need that bonus star will now have to ensure high performance across all six measures to ensure that they can reach the 5 star threshold.
Overall Impact
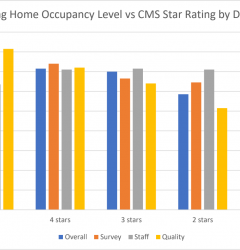
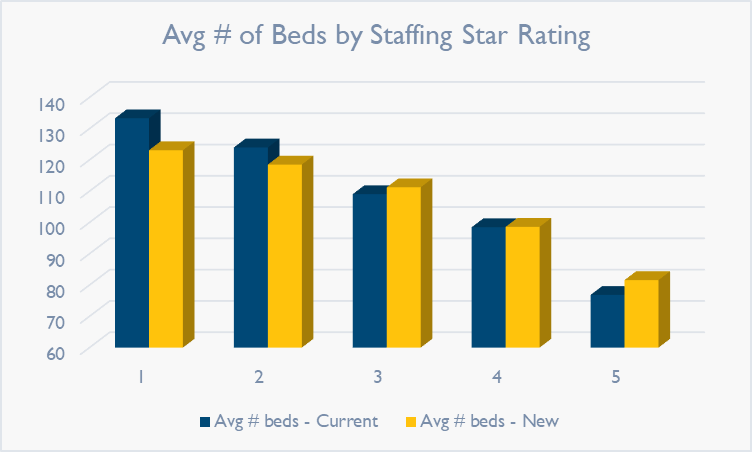
The benefits from these changes are clear. Consumers and concerned parties now have a better picture of the staffing picture inside a home, and operators are being held to account beyond just hours per resident day. But for operators trying to juggle a million priorities, this new change combined with the obvious penalty it represents to homes across the board, it’s hard to see the sunny side. CMS still has not addressed regional staffing availability or expense in their model, leaving those homes struggling to keep up. They also haven’t addressed the structural imbalances that penalize larger homes who may be taking advantage of economies of scale with their staffing, instead continuing to favor smaller homes with higher ratings:
It’s important to keep in mind that these are all projections based on today’s data. While we don’t expect a dramatic shift in the PBJ-based data that powers these ratings, we’ll have to check these numbers again next month when the new ratings come out. Watch this space for that analysis.