
Survey Star Rating Walkthrough
Overview
In order to remain certified to treat Medicare and Medicaid patients, each facility is subject to an annual Health Inspection, or Nursing Home Star Rating Survey.
Each year, a team of independent state examiners inspect patient safety, physical hazards, cleanliness and regulatory compliance during an unannounced visit.
For each shortcoming on the inspection, the facility is issued a deficiency. Points are assigned based on the scope and severity of the deficiency.
In order to calculate the Nursing Home Survey Star Rating, the points from the past 3 survey cycles are totaled, weighted, and compared against all the other homes in a given state.
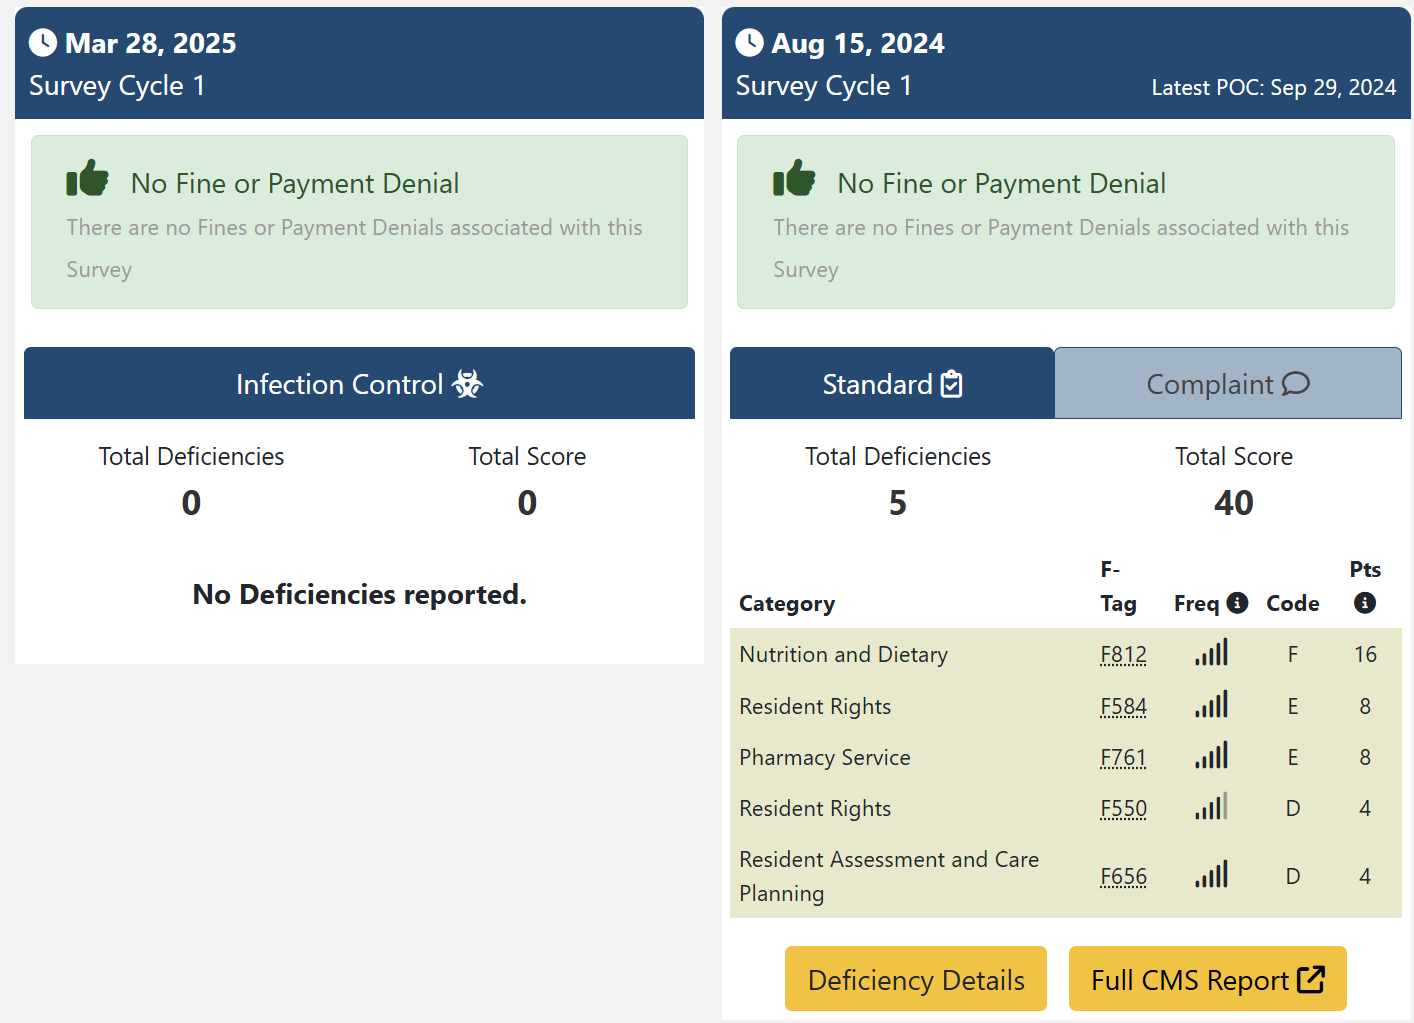
Nursing Home Survey Types
Each year, surveyors conduct a Standard Survey, after which they’ll report any deficiencies to the facility. That facility then has time to review, dispute, and correct any deficiencies found.
Afterwards, surveyors may conduct a follow-up or Revisit Survey to ensure that any deficiencies found have been corrected. If they have not, repeat revisits may be required. Each revisit beyond the first carries an additional penalty on the total points for any deficiencies not corrected.
In addition, surveyors may conduct ad hoc Complaint Surveys in response to official complaints lodged against the facility at any point during the year. These surveys may result in additional deficiencies.
During the Covid-19 pandemic, CMS also started conducting Infection Control Surveys to check on facilities’ adherence to infection control protocols. These have largely tapered off, but some are still being conducted.
The surveyor may also conduct more than one survey type in the same visit.
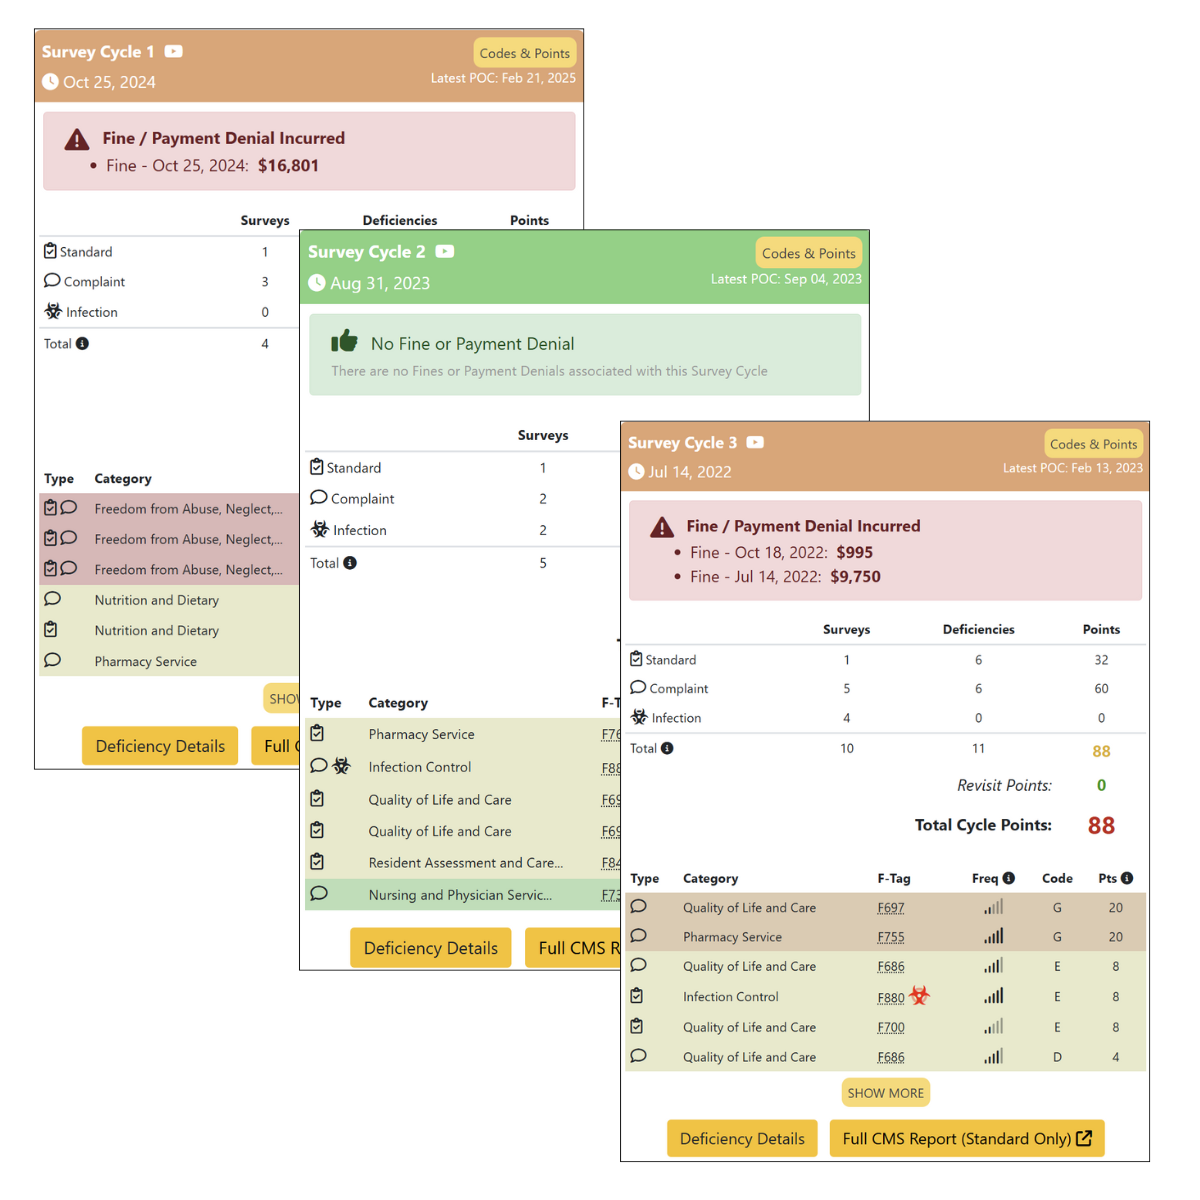
Survey Cycles
The Survey Star Rating is not just based on the latest Surveys, there are actually two Survey Cycles. Each Cycle is anchored by a Standard Survey, but points from Complaint and Infection Control Surveys are added to them based on a roll12-month cycle.
This is an area where it’s easy to be confused. Essentially, any time there’s a new Standard Survey, it becomes the new anchor of Cycle 1. The old Standard Survey from Cycle 1 moves to Cycle 2, then the one currently anchoring Cycle 2 actually falls off!
Meanwhile, points from Complaint and Infection Control Surveys (more on the points in a minute) move between cycles every month. Cycle 1 includes points from deficiencies cited in the last 12 months and Cycle 2 collects those from 12-36 months ago. Anything older than 36 months falls off automatically.
This means that while homes often think they need to wait for a new Standard Survey to improve their Survey Star Rating, they may find that as Complaint and Infection Control tags roll off automatically, they may get an unexpected boost! More on this to come.
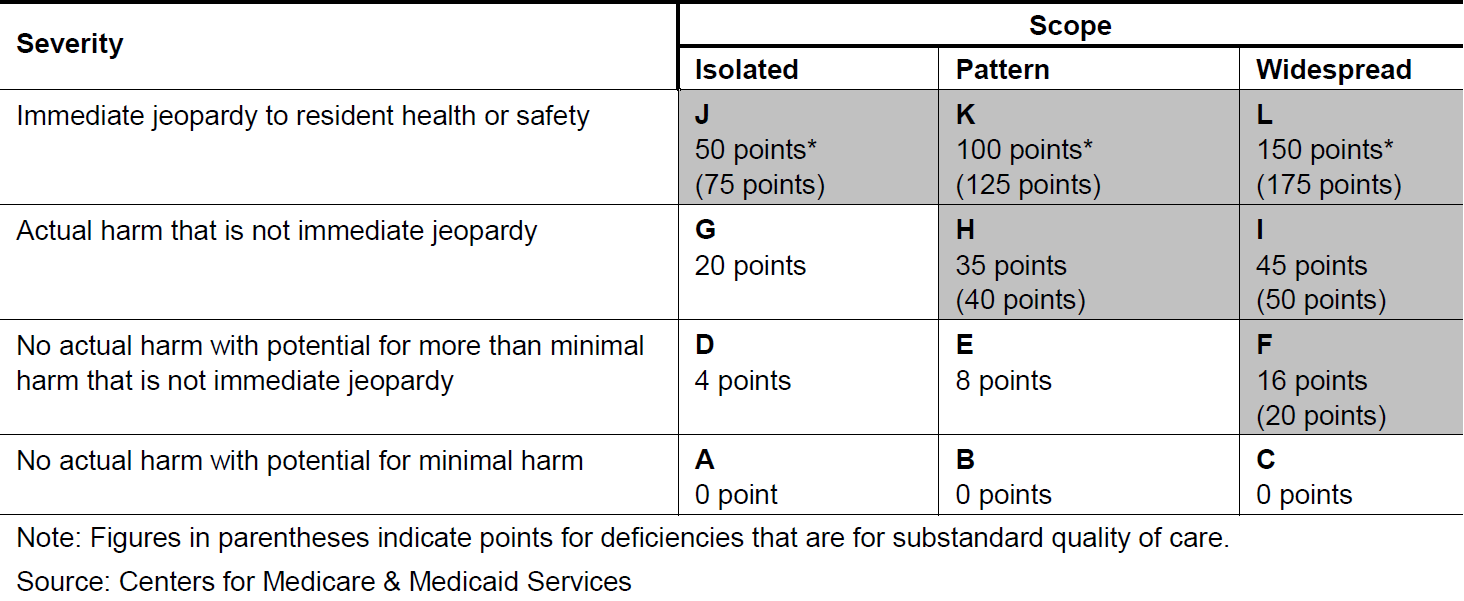
Deficiencies & Points
Surveys are made up of Deficiencies or citations, each of which carries a Scope/Severity level denoted by a letter, then a corresponding point value based on that. This chart shows those levels and points associated with each.
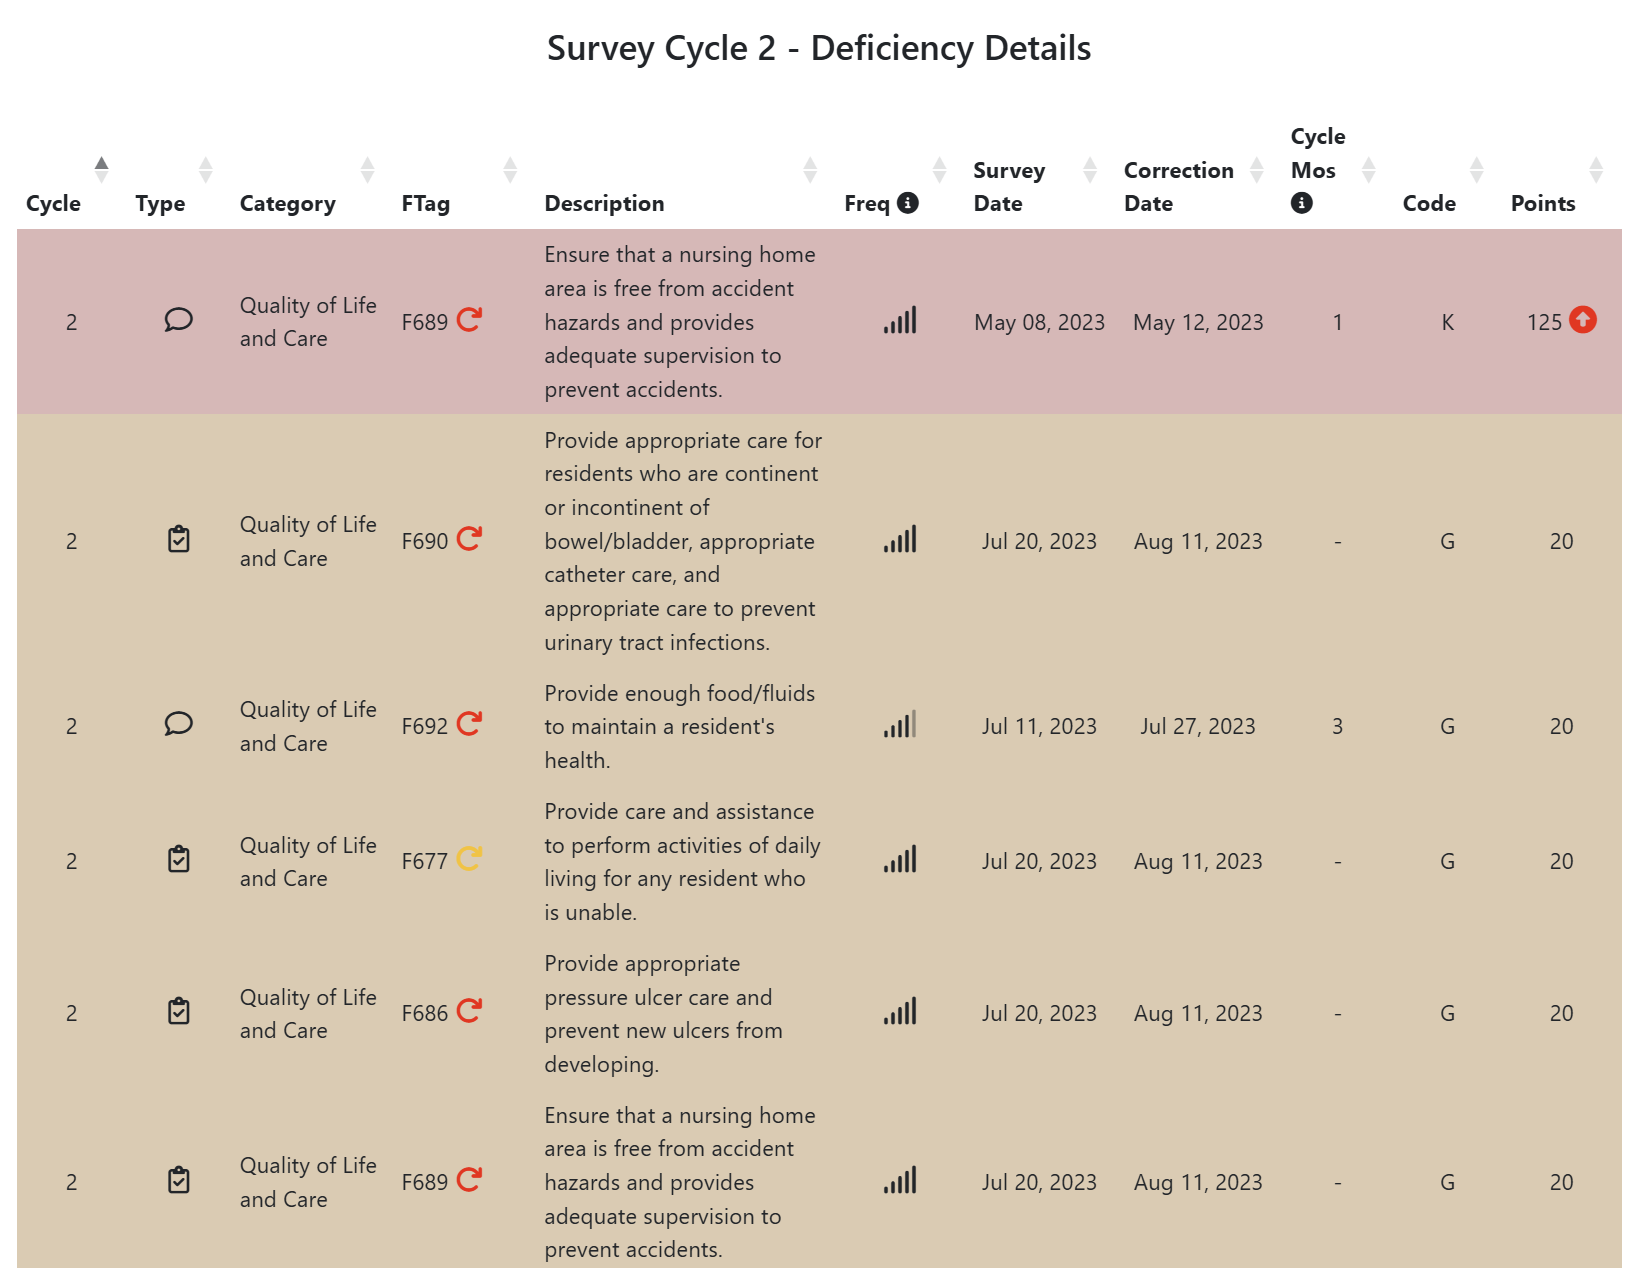
Deficiency Details
In addition to Scope/Severity and points, each deficiency has an F-Tag, which describes the issue cited, a date and a correction date. Certain F-Tags result in a higher point total — these are called Sub-Standard Quality of Care (SQC) deficiencies.
StarPRO also analyzes the facility’s Survey history to identify Repeat Tags, which are areas where the facility has been cited multiple times.
We also analyze the local market / State Survey Region to assign a Frequency, e.g. how often that F-Tag is cited by local surveyors. These can help facility management understand how to prepare for future Surveys.
Click below to see for yourself!
Survey Star Rating Calculation
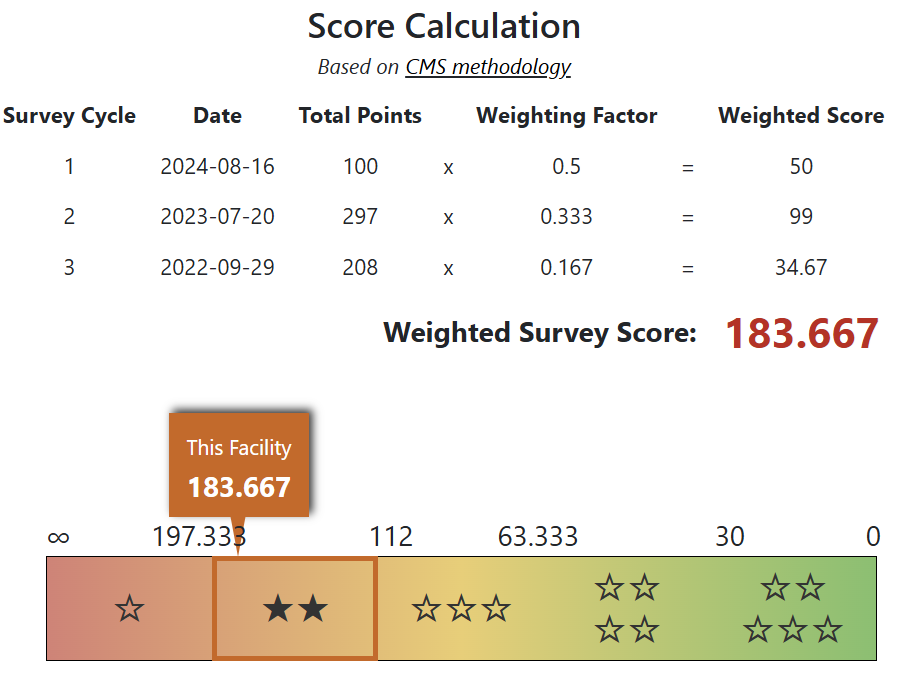
In order to determine the Survey Star Rating, each Inspection’s total points are weighted:
Survey Cycle 1: 75%
Survey Cycle 2: 25%
The weighted scores are then added together to create the Weighted Survey Score. Each facility’s Weighted Survey Score is then compared against state-specific cutpoints that are calculated based on the performance of all facilities in the state:
The top performing 10% of facilities in the state (those with the lowest Weighted Survey Score) receive a rating of 5 Stars.
The middle 70% of facilities receive 2, 3 or 4 Stars, with an equal number (approx 23.33%) in each category.
The bottom 20% of facilities (those with the highest Weighted Survey Score) receive 1 Star.
Each month, the cutpoints for each state are adjusted based on any new surveys that come in, to ensure that the above 10/70/20 rule is being applied continuously.
Interestingly, this can lead to some facilities gaining or losing a star without even having a new survey! As a result, facilities with Weighted Survey Scores close to the cutpoints need to pay extra attention to the monthly changes.
Abuse
CMS has also added new guidelines for facilities with a history of severe Abuse deficiencies. Facilities with this designation are capped at 2 Stars for the Survey Rating, no matter how much higher they may have been.
Click here to read more about the Abuse flag.
Differences Between States
While CMS sets the survey guidelines at the federal level, it’s up to each state’s health department to determine how to interpret and apply the guidelines. As a result, survey results can vary wildly between states. See the map below for details:
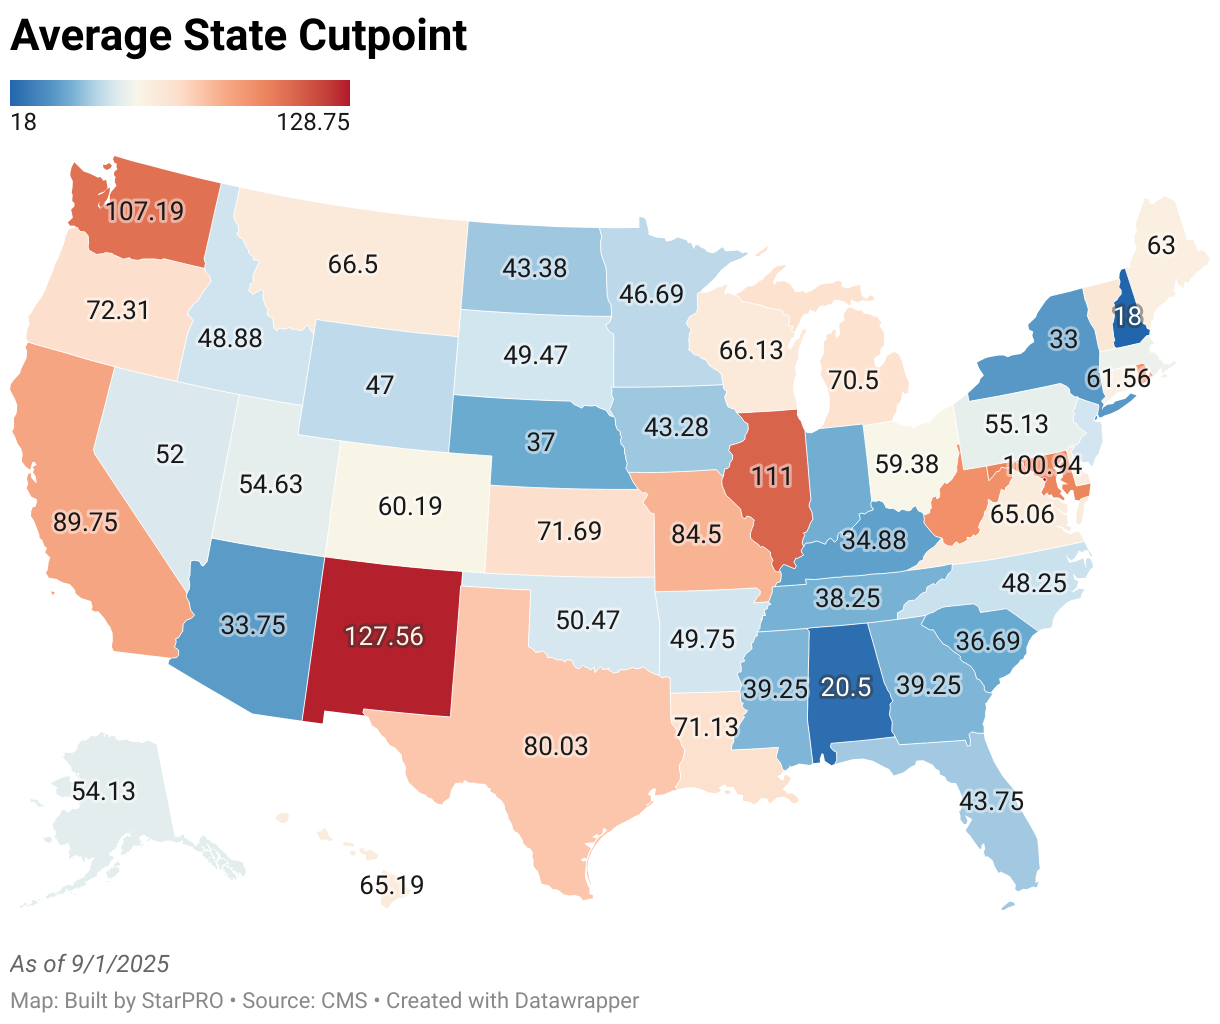
At first glance, it may seem that states like Washington and New Mexico are “bad”, and states like New Hampshire are “good.” But high vs. low only tells part of the story.
Homes in high scoring states expect a higher count and severity of deficiencies in their Surveys, and they’re graded against their peers in the state. Recall that each state has a different matrix and set of cutpoints, with the top 10% earning 5 stars, the bottom 20% earning 1 star, and the middle 70% making up the rest.
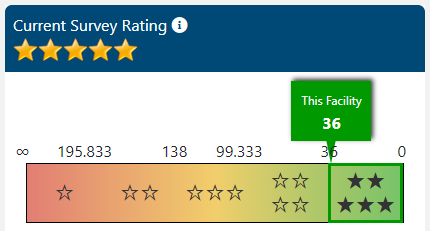
The result: a facility with a Weighted Survey Score of 36 would be a 1-star in New Hampshire, but they’d be 5 stars in New Mexico!
New Hampshire

New Mexico
Industry professionals know that healthcare is a local business, and that sometimes means comparing homes across state lines. But it’s important to remember that Nursing Home Survey Star Rating results always need to be considered only in the context of their own state, not their region.
For a deep dive on StarPRO’s capabilities around Survey — including our Survey Point Simulator — schedule a demo with us today!